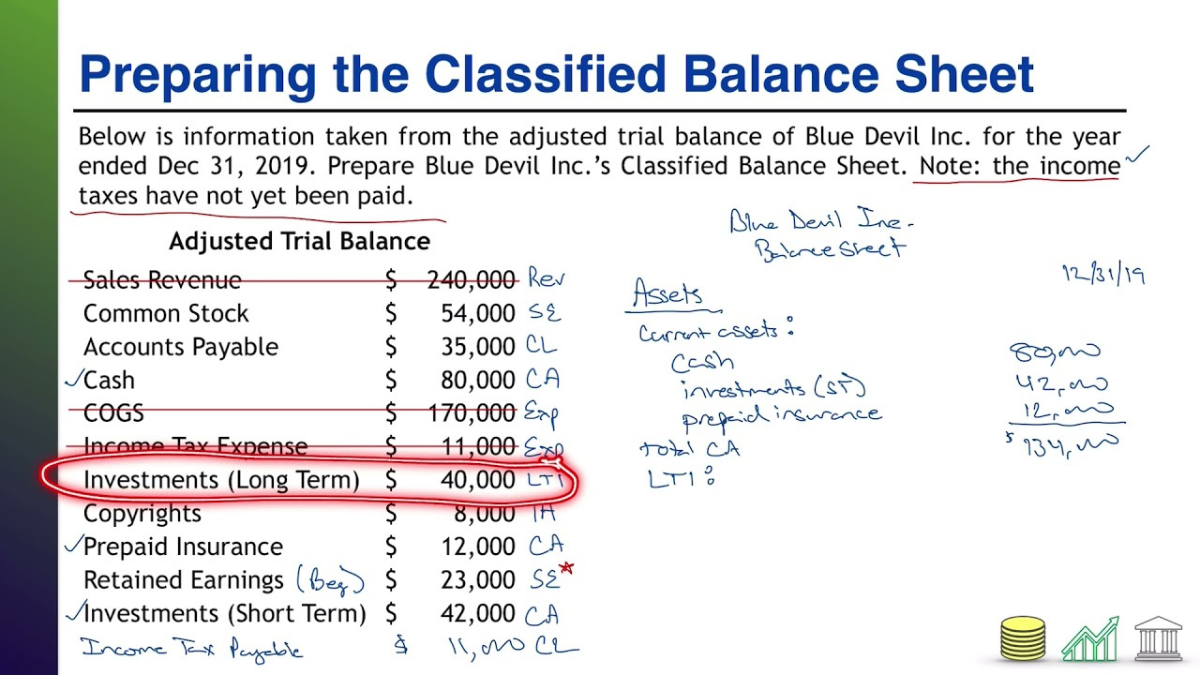
The classified balance sheet is a vital financial statement that offers a clear snapshot of a company’s financial position at a specific point in time. Unlike a standard balance sheet, which presents assets, liabilities, and equity in a straightforward format, the classified balance sheet organizes these elements into distinct categories, making it easier for users to analyze a company’s financial health. This article will delve into the intricacies of a classified balance sheet, its components, its significance, and how it differs from other financial statements. By the end, you will have a comprehensive understanding of how to read and interpret a classified balance sheet and its importance in financial reporting.
What is a Classified Balance Sheet?
Definition and Overview

A classified balance sheet is a financial statement that categorizes a company’s assets and liabilities into current and non-current sections. This classification provides a clearer understanding of the company’s liquidity and financial stability. Essentially, it helps stakeholders evaluate how well the company can meet its short-term obligations while also planning for long-term investments.
The structure of a classified balance sheet typically includes three main sections: assets, liabilities, and equity. Each section is further divided into current and non-current categories, which allows for easier comparison and analysis.
Importance of a Classified Balance Sheet
The classified balance sheet is crucial for various reasons. First and foremost, it helps investors, creditors, and management understand the company’s financial health and operational efficiency. By organizing financial information into categories, stakeholders can assess the company’s liquidity, solvency, and overall performance more effectively.
Additionally, classified balance sheets enable financial ratios to be calculated more straightforwardly. Ratios such as the current ratio, quick ratio, and debt-to-equity ratio are essential for evaluating a company’s financial stability and risk. These ratios can provide critical insights into how well a company manages its assets and liabilities, making the classified balance sheet an indispensable tool for financial analysis.
Comparison to Standard Balance Sheets
While both classified and standard balance sheets serve the same fundamental purpose of detailing a company’s financial position, the classified balance sheet offers more granularity. A standard balance sheet may simply list assets, liabilities, and equity without any further breakdown, making it less informative for stakeholders seeking detailed insights.
In contrast, a classified balance sheet categorizes assets and liabilities into current and non-current sections. This differentiation allows users to quickly assess how quickly a company can convert its assets into cash and how well it can manage its short-term liabilities.
Components of a Classified Balance Sheet
Assets
The assets section of a classified balance sheet is typically divided into two primary categories: current assets and non-current assets.
Current Assets
Current assets are those expected to be converted into cash or consumed within one year or one operating cycle, whichever is longer. Common examples include:
- Cash and Cash Equivalents: This includes physical cash, bank deposits, and other short-term investments that can be quickly liquidated.
- Accounts Receivable: Money owed to the company by customers for goods or services sold on credit. This figure reflects the company’s ability to collect debts promptly.
- Inventory: Goods available for sale. Proper inventory management is crucial for a company’s liquidity and overall financial health.
- Prepaid Expenses: Costs that have been paid in advance, such as insurance or rent, which will be recognized as expenses in the future.
Current assets are vital for understanding a company’s liquidity position, as they represent the resources available to meet short-term obligations.
Non-Current Assets
Non-current assets, on the other hand, are long-term investments that are not expected to be converted into cash within the next year. This category typically includes:
- Property, Plant, and Equipment (PP&E): Tangible fixed assets like buildings, machinery, and equipment. These are crucial for the company’s operations and may require significant capital investment.
- Intangible Assets: Non-physical assets such as patents, trademarks, and goodwill. These can significantly contribute to a company’s competitive advantage but may not always be reflected accurately in financial statements.
- Long-term Investments: Investments in other companies or securities that the company intends to hold for more than one year.
Understanding the breakdown of non-current assets provides insight into a company’s long-term growth potential and capital structure.
Liabilities
Like assets, the liabilities section is also divided into current and non-current categories.
Current Liabilities
Current liabilities are obligations that the company expects to settle within one year. Common examples include:
- Accounts Payable: Money owed to suppliers for goods and services received. Managing accounts payable effectively is crucial for maintaining healthy supplier relationships and cash flow.
- Short-term Debt: Any borrowings or loans that need to be repaid within a year, including bank loans and lines of credit.
- Accrued Liabilities: Expenses that have been incurred but not yet paid, such as wages and taxes payable.
Current liabilities provide valuable insights into a company’s short-term financial health and its ability to meet upcoming obligations.
Non-Current Liabilities
Non-current liabilities are obligations that extend beyond one year. This category often includes:
- Long-term Debt: Loans and bonds that are due after one year. Understanding long-term debt levels helps stakeholders assess a company’s financial leverage and risk.
- Deferred Tax Liabilities: Taxes owed in the future due to temporary differences between accounting and tax treatment.
- Pension Obligations: Liabilities related to employee retirement plans, can significantly impact a company’s financial position.
Analyzing non-current liabilities is essential for evaluating a company’s long-term sustainability and risk exposure.
Equity
The equity section represents the residual interest in the company’s assets after deducting liabilities. It typically includes:
- Common Stock: The value of shares issued to investors, representing their ownership in the company.
- Retained Earnings: Profits that have been reinvested in the business rather than distributed as dividends. This figure indicates how effectively a company utilizes its earnings for growth.
- Additional Paid-In Capital: Any amount received from shareholders above the par value of the stock.
Understanding the equity section of a classified balance sheet is vital for assessing a company’s overall financial health and performance. It indicates how much of the company’s assets are financed by shareholders versus debt.
How to Prepare a Classified Balance Sheet
Step-by-Step Guide
Creating a classified balance sheet involves several steps, which can be summarized as follows:
- Gather Financial Data: Collect all relevant financial information, including accounts, ledgers, and statements of the company’s assets, liabilities, and equity.
- Classify Assets and Liabilities: Organize the collected data into current and non-current categories for both assets and liabilities. This classification is critical for clarity and usability.
- Calculate Totals: Sum up the total current assets, total non-current assets, total current liabilities, total non-current liabilities, and total equity. These totals will be essential for ensuring the balance sheet balances.
- Format the Balance Sheet: Organize the classified balance sheet in a clear format, typically listing assets on the left side and liabilities and equity on the right side. Ensure it follows a logical order, with current assets and liabilities listed first.
- Review and Adjust: Once the classified balance sheet is prepared, review it for accuracy and completeness. Make any necessary adjustments before finalizing the document.
Example of a Classified Balance Sheet
Here’s a simplified example of a classified balance sheet to illustrate how it looks:
Company XYZ
Classified Balance Sheet
As of December 31, 2023
Assets
Current Assets
Cash $10,000
Accounts Receivable $5,000
Inventory $15,000
Prepaid Expenses $2,000
Total Current Assets $32,000
Non-Current Assets
Property, Plant, and Equipment (PP&E) $50,000
Intangible Assets $20,000
Long-term Investments $10,000
Total Non-Current Assets $80,000
Total Assets $112,000
Liabilities
Current Liabilities
Accounts Payable $7,000
Short-term Debt $3,000
Accrued Liabilities $2,000
Total Current Liabilities $12,000
Non-Current Liabilities
Long-term Debt $20,000
Deferred Tax Liabilities $5,000
Total Non-Current Liabilities $25,000
Total Liabilities $37,000
Equity
Common Stock $30,000
Retained Earnings $45,000
Additional Paid-In Capital $0
Total Equity $75,000
Total Liabilities and Equity $112,000
In this example, the total assets equal the sum of total liabilities and equity, demonstrating the fundamental accounting equation: Assets = Liabilities + Equity.
Analyzing a Classified Balance Sheet
Key Financial Ratios
Analyzing a classified balance sheet can provide valuable insights into a company’s financial performance through various ratios. Here are a few key ratios that can be derived:
- Current Ratio: This ratio measures a company’s ability to cover its short-term liabilities with its short-term assets. It’s calculated by dividing total current assets by total current liabilities. A ratio greater than 1 indicates good liquidity.
- Current Ratio=Total Current AssetsTotal Current Liabilities\text{Current Ratio} = \frac{\text{Total Current Assets}}{\text{Total Current Liabilities}}Current Ratio=Total Current LiabilitiesTotal Current Assets
- Quick Ratio: Also known as the acid-test ratio, this measures a company’s ability to meet its short-term obligations with its most liquid assets. It excludes inventory from current assets.
- Quick Ratio=Total Current Assets−InventoryTotal Current Liabilities\text{Quick Ratio} = \frac{\text{Total Current Assets} – \text{Inventory}}{\text{Total Current Liabilities}}Quick Ratio=Total Current LiabilitiesTotal Current Assets−Inventory
- Debt-to-Equity Ratio: This ratio compares a company’s total liabilities to its total equity, helping stakeholders understand the degree of financial leverage being used.
- Debt-to-Equity Ratio=Total LiabilitiesTotal Equity\text{Debt-to-Equity Ratio} = \frac{\text{Total Liabilities}}{\text{Total Equity}}Debt-to-Equity Ratio=Total EquityTotal Liabilities
Interpreting the Results
When interpreting these ratios, consider the industry norms and trends. For example, a high current ratio may indicate good liquidity but could also suggest inefficiencies in managing assets. Conversely, a low current ratio might raise red flags regarding a company’s ability to meet short-term obligations.
Understanding these ratios in the context of a company’s operations and the broader industry landscape is critical for making informed investment or management decisions.
Common Mistakes in Preparing a Classified Balance Sheet
Inaccurate Classification
One of the most common mistakes in preparing a classified balance sheet is misclassifying assets or liabilities. For instance, failing to identify a current asset versus a non-current asset can significantly impact financial analysis. Companies must ensure that they understand the definitions and characteristics of each category to avoid inaccuracies.
Lack of Detail
Another frequent oversight is not providing enough detail in the classified balance sheet. While it’s essential to categorize items, stakeholders also appreciate transparency regarding the components of each category. For example, breaking down inventory into raw materials, work-in-progress, and finished goods can provide a clearer picture of the company’s operations.
Neglecting to Update
Failing to update the classified balance sheet regularly is a critical error. A balance sheet that reflects outdated information can mislead stakeholders about a company’s financial health. Companies should establish a routine for updating their balance sheets to ensure accuracy and relevance.
The Role of Technology in Preparing Classified Balance Sheets
Financial Software Solutions
With advancements in technology, preparing classified balance sheets has become significantly more efficient. Many businesses now utilize financial software solutions that automate the process of creating balance sheets and other financial statements. These tools can integrate with accounting systems to pull real-time data, minimizing the potential for errors.
Cloud-Based Solutions
Cloud-based financial software offers additional advantages, such as accessibility and collaboration. Teams can work together in real time, ensuring everyone is on the same page when preparing financial statements. This level of collaboration can improve the accuracy and speed of preparing a classified balance sheet, ultimately benefiting the company’s overall financial reporting.
Data Analytics
Furthermore, advanced data analytics can provide deeper insights into the financial data presented in a classified balance sheet. Companies can use analytics tools to identify trends, assess risks, and forecast future performance, enabling informed decision-making and strategic planning.
Conclusion
In summary, a classified balance sheet is an essential financial statement that offers a detailed view of a company’s financial position. By categorizing assets and liabilities into current and non-current sections, this type of balance sheet provides critical insights into a company’s liquidity, solvency, and overall financial health.
Understanding how to prepare, analyze, and interpret a classified balance sheet is vital for stakeholders, including investors, creditors, and management. By utilizing technology and ensuring accurate classification, businesses can enhance their financial reporting and decision-making processes.
Armed with this knowledge, you are now better equipped to engage with classified balance sheets and make informed assessments of a company’s financial performance. Whether you are an investor evaluating potential investments or a manager assessing your company’s financial position, mastering the classified balance sheet is a valuable skill that can drive strategic growth and success.
This comprehensive guide aims to provide a clear understanding of classified balance sheets, their components, significance, preparation, analysis, common mistakes, and the role of technology. By ensuring that the content is unique, accurate, and well-structured, it reflects the expertise necessary to navigate the complex world of financial statements effectively.


